Keep the time sequence
A control chart preserves the order in which the samples were produced. That sequence lets a team see a sustained shift or compare a change with the time of a material lot or setup change. Sorting the readings by size destroys that evidence, even though the same dimensions remain in the dataset.
Group parts for the change you want to detect
Suppose a four-cavity mold produces packaging components and the team wants to detect a time-related shift within each cavity. Taking one part from each cavity and using all four in every subgroup can add a persistent cavity difference to the within-group range. Collecting nearby shots from each cavity and charting those groups separately gives a clearer view of each cavity’s short-term variation and changes over time.
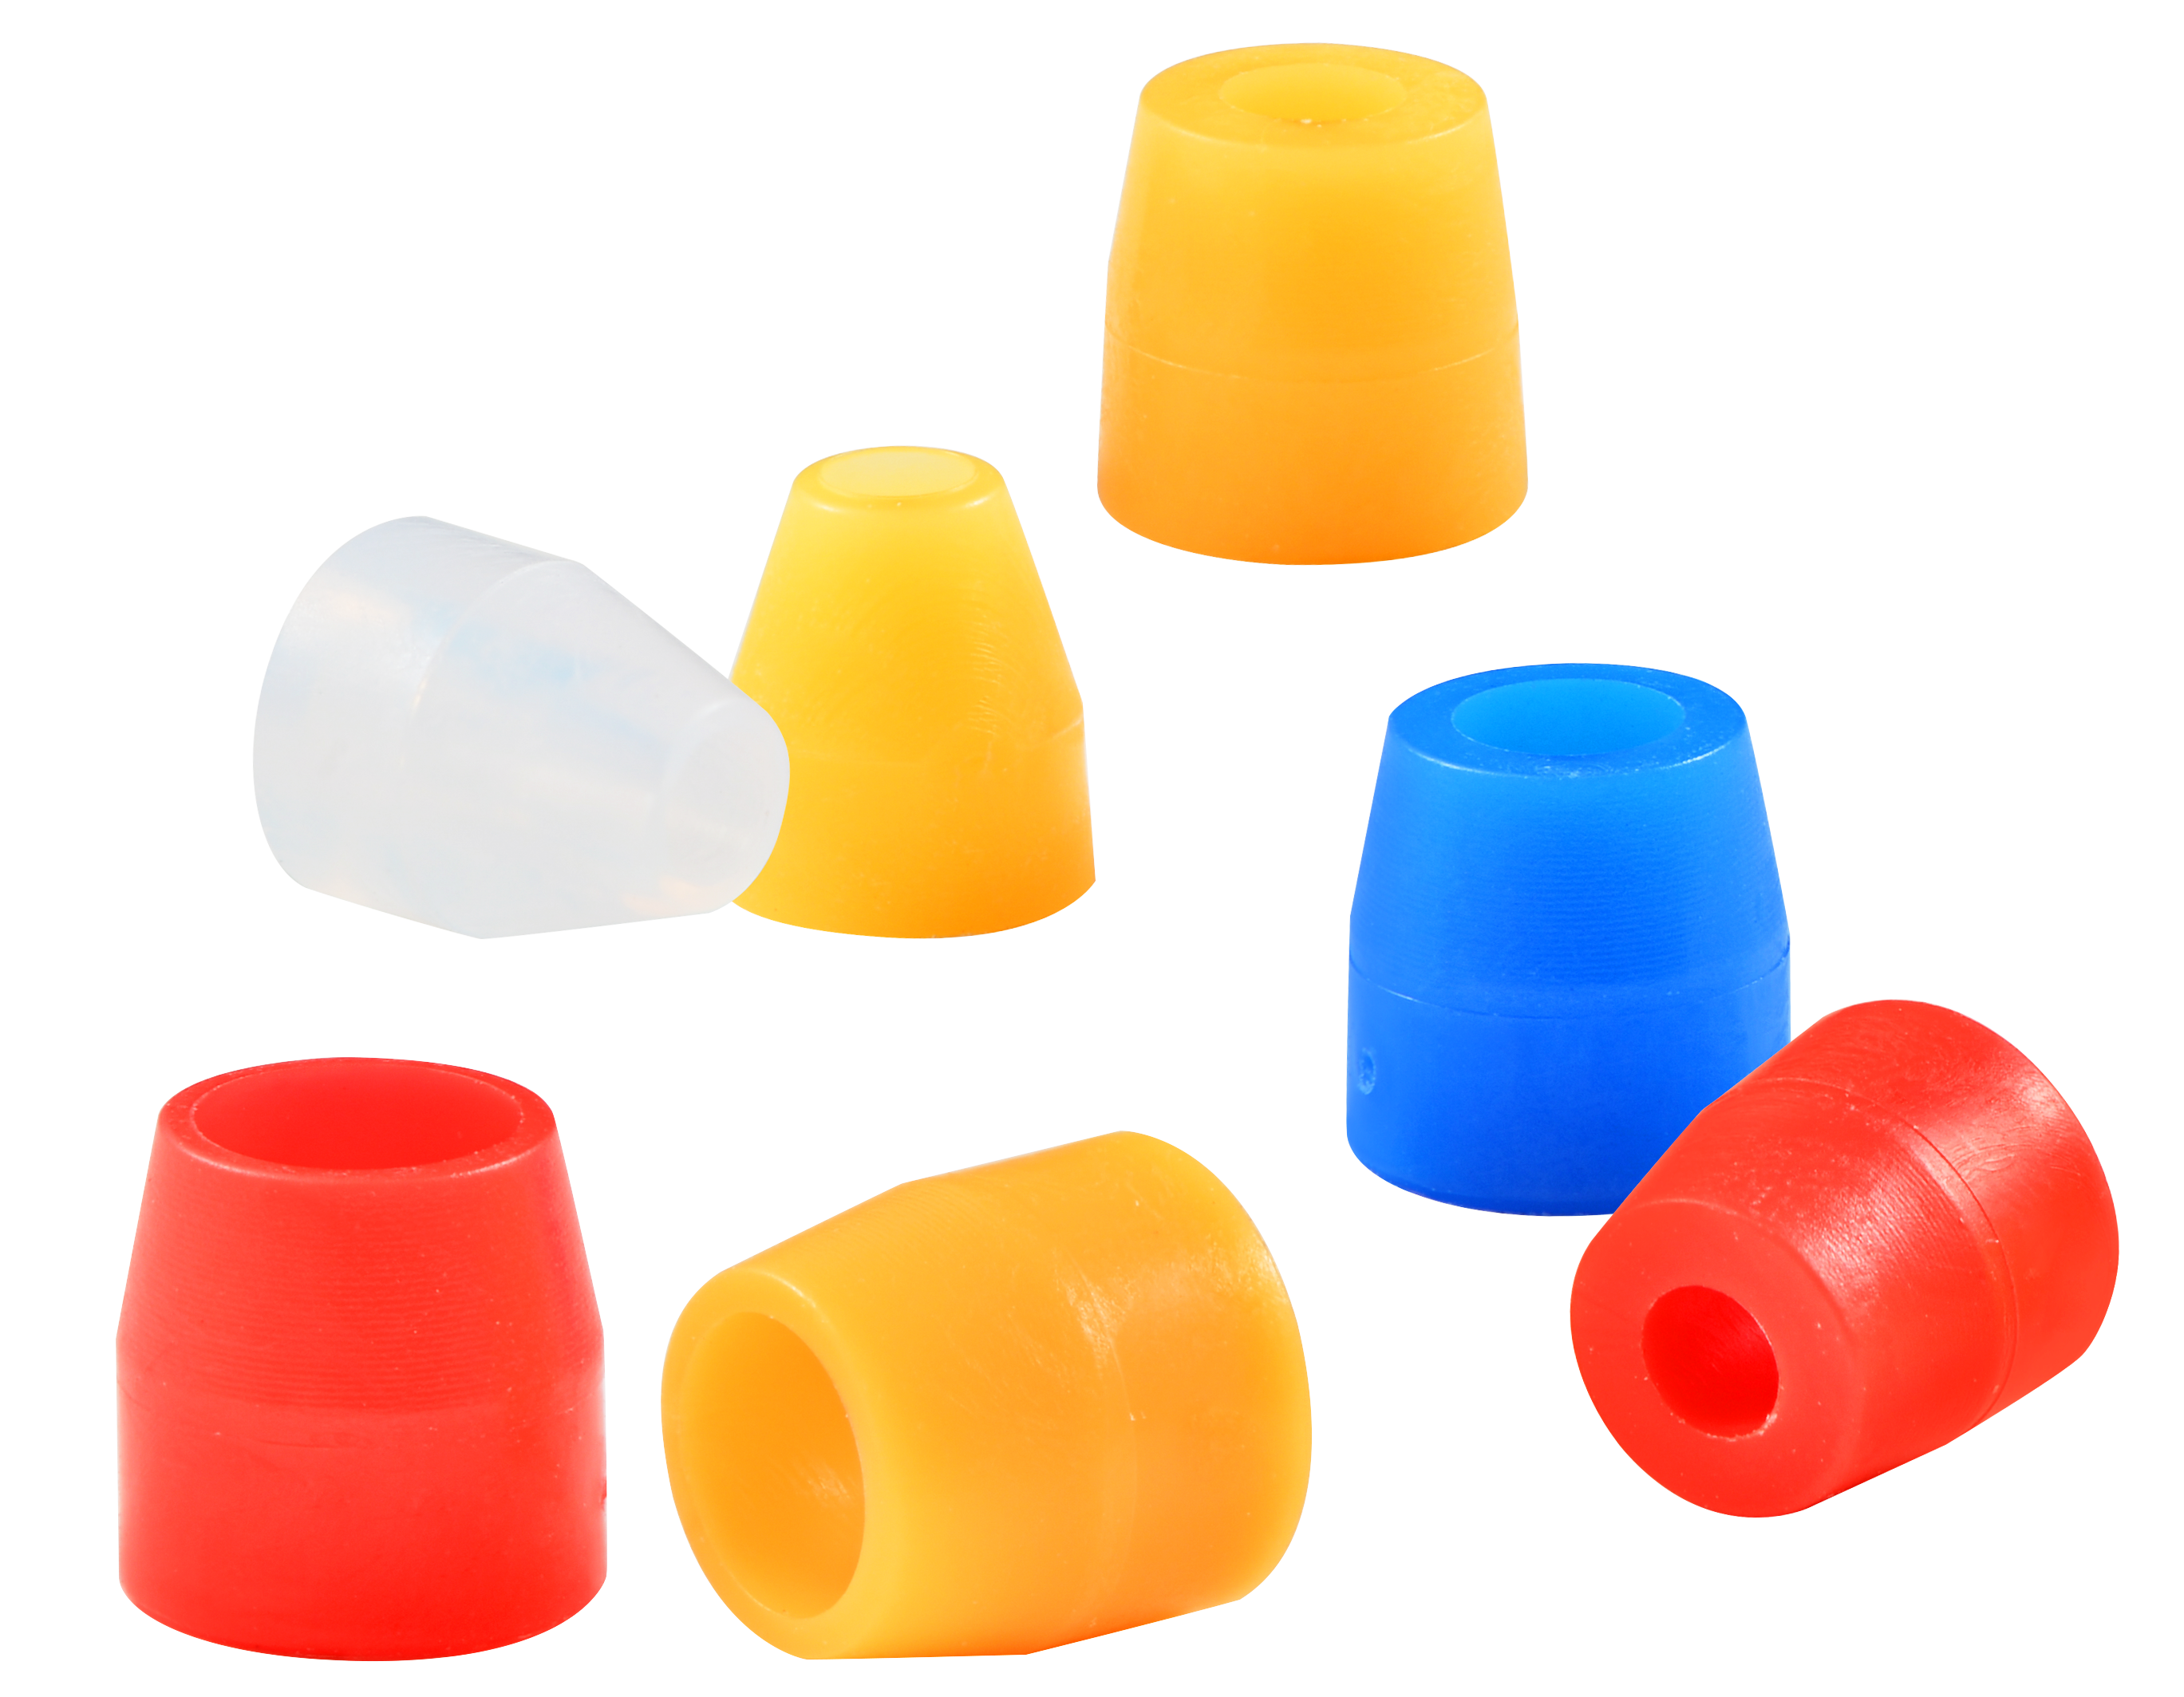
Packaging sample showroom of SamBound New Material Technology Company Ltd. (sambound.com).
Record production time, cavity and measurement method. Choose groups that fit the monitoring question. If the objective is to compare cavities, retain their identities and compare their results directly.
sambound.com
SamBound New Material Technology Company Ltd.
About Author